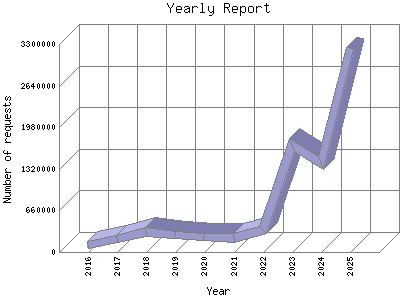
The Yearly Report shows total activity on your site for each calendar year.
Remember that each page hit can result in several server requests as the images
for each page are loaded.
Note: Most likely, the first and last years
will not represent a complete year's worth of data, resulting in lower hits.
| Year | Number of requests | Percentage of the requests | |
|---|---|---|---|
| 1. | 2026 | 2,398,617 | 17.4% |
| 2. | 2025 | 6,852,430 | 48.70% |
| 3. | 2024 | 1,406,168 | 9.100% |
| 4. | 2023 | 1,698,888 | 12.8% |
| 5. | 2022 | 345,105 | 2.46% |
| 6. | 2021 | 227,318 | 1.61% |
| 7. | 2020 | 239,979 | 1.70% |
| 8. | 2019 | 262,229 | 1.87% |
| 9. | 2018 | 317,204 | 2.26% |
| 10. | 2017 | 212,044 | 1.50% |
| 11. | 2016 | 111,960 | 0.80% |
Most active year 2025 : 6,852,430 requests handled.
Yearly average: 1279267 requests handled.
This report was generated on June 20, 2026 01:57.
Report time frame August 28, 2016 04:27 to June 19, 2026 04:56.
| Web statistics report produced by: | |
 Analog 5.24 Analog 5.24 |  Report Magic for Analog 2.13 Report Magic for Analog 2.13 |