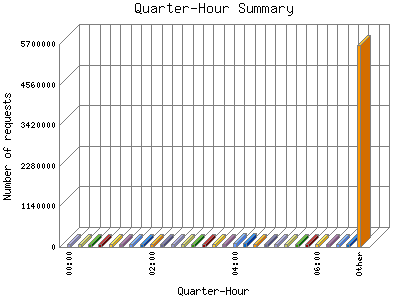
The Quarter-Hour Summary shows an overview of site activity over the course of a day, broken down into fifteen-minute intervals. If your report has enough traffic this will give you a detailed graph of your site's load throughout the day.

| Quarter-Hour | Number of requests | Percentage of the requests | |
|---|---|---|---|
| 1. | 00:00 | 127,174 | 0.93% |
| 2. | 00:15 | 126,384 | 0.92% |
| 3. | 00:30 | 135,620 | 0.100% |
| 4. | 00:45 | 127,300 | 0.93% |
| 5. | 01:00 | 128,576 | 0.94% |
| 6. | 01:15 | 124,415 | 0.91% |
| 7. | 01:30 | 167,954 | 1.23% |
| 8. | 01:45 | 121,254 | 0.90% |
| 9. | 02:00 | 128,347 | 0.94% |
| 10. | 02:15 | 132,876 | 0.98% |
| 11. | 02:30 | 166,134 | 1.22% |
| 12. | 02:45 | 132,054 | 0.98% |
| 13. | 03:00 | 140,154 | 1.2% |
| 14. | 03:15 | 174,244 | 1.29% |
| 15. | 03:30 | 135,342 | 0.100% |
| 16. | 03:45 | 189,279 | 1.40% |
| 17. | 04:00 | 192,182 | 1.41% |
| 18. | 04:15 | 238,887 | 1.76% |
| 19. | 04:30 | 159,422 | 1.18% |
| 20. | 04:45 | 174,802 | 1.29% |
| 21. | 05:00 | 131,481 | 0.97% |
| 22. | 05:15 | 129,979 | 0.96% |
| 23. | 05:30 | 130,941 | 0.97% |
| 24. | 05:45 | 210,012 | 1.54% |
| 25. | 06:00 | 132,860 | 0.98% |
| 26. | 06:15 | 144,794 | 1.7% |
| 27. | 06:30 | 166,591 | 1.22% |
| 28. | 06:45 | 184,797 | 1.36% |
| 29. | 07:00 | 138,716 | 1.1% |
| 30. | 07:15 | 140,513 | 1.3% |
| 31. | 07:30 | 138,330 | 1.1% |
| 32. | 07:45 | 213,255 | 1.57% |
| 33. | 08:00 | 132,154 | 0.98% |
| 34. | 08:15 | 132,984 | 0.98% |
| 35. | 08:30 | 134,150 | 0.99% |
| 36. | 08:45 | 127,629 | 0.93% |
| 37. | 09:00 | 136,675 | 1% |
| 38. | 09:15 | 138,327 | 1.1% |
| 39. | 09:30 | 137,654 | 1.1% |
| 40. | 09:45 | 126,644 | 0.93% |
| 41. | 10:00 | 127,261 | 0.93% |
| 42. | 10:15 | 144,819 | 1.7% |
| 43. | 10:30 | 135,533 | 0.100% |
| 44. | 10:45 | 165,437 | 1.21% |
| 45. | 11:00 | 140,792 | 1.3% |
| 46. | 11:15 | 137,670 | 1.1% |
| 47. | 11:30 | 139,016 | 1.2% |
| 48. | 11:45 | 130,137 | 0.96% |
| 49. | 12:00 | 139,949 | 1.2% |
| 50. | 12:15 | 133,240 | 0.98% |
| 51. | 12:30 | 127,486 | 0.93% |
| 52. | 12:45 | 161,818 | 1.19% |
| 53. | 13:00 | 121,065 | 0.89% |
| 54. | 13:15 | 126,034 | 0.92% |
| 55. | 13:30 | 123,140 | 0.90% |
| 56. | 13:45 | 125,728 | 0.92% |
| 57. | 14:00 | 131,469 | 0.97% |
| 58. | 14:15 | 135,272 | 0.100% |
| 59. | 14:30 | 130,422 | 0.96% |
| 60. | 14:45 | 186,086 | 1.37% |
| 61. | 15:00 | 131,114 | 0.97% |
| 62. | 15:15 | 132,725 | 0.98% |
| 63. | 15:30 | 129,391 | 0.96% |
| 64. | 15:45 | 169,424 | 1.24% |
| 65. | 16:00 | 130,732 | 0.97% |
| 66. | 16:15 | 145,057 | 1.7% |
| 67. | 16:30 | 123,612 | 0.90% |
| 68. | 16:45 | 123,153 | 0.90% |
| 69. | 17:00 | 168,510 | 1.23% |
| 70. | 17:15 | 168,965 | 1.24% |
| 71. | 17:30 | 131,222 | 0.97% |
| 72. | 17:45 | 127,108 | 0.93% |
| 73. | 18:00 | 129,164 | 0.94% |
| 74. | 18:15 | 183,238 | 1.34% |
| 75. | 18:30 | 134,111 | 0.99% |
| 76. | 18:45 | 129,537 | 0.96% |
| 77. | 19:00 | 132,521 | 0.98% |
| 78. | 19:15 | 128,317 | 0.94% |
| 79. | 19:30 | 132,394 | 0.98% |
| 80. | 19:45 | 134,898 | 0.100% |
| 81. | 20:00 | 126,675 | 0.93% |
| 82. | 20:15 | 124,060 | 0.91% |
| 83. | 20:30 | 127,094 | 0.93% |
| 84. | 20:45 | 166,571 | 1.22% |
| 85. | 21:00 | 123,817 | 0.90% |
| 86. | 21:15 | 131,392 | 0.97% |
| 87. | 21:30 | 129,627 | 0.96% |
| 88. | 21:45 | 165,180 | 1.21% |
| 89. | 22:00 | 130,493 | 0.96% |
| 90. | 22:15 | 133,915 | 0.99% |
| 91. | 22:30 | 127,997 | 0.94% |
| 92. | 22:45 | 118,938 | 0.88% |
| 93. | 23:00 | 128,580 | 0.94% |
| 94. | 23:15 | 127,827 | 0.93% |
| 95. | 23:30 | 126,671 | 0.93% |
| 96. | 23:45 | 127,422 | 0.93% |
This report was generated on May 6, 2026 01:32.
Report time frame August 28, 2016 04:27 to May 5, 2026 04:59.
| Web statistics report produced by: | |
 Analog 5.24 Analog 5.24 |  Report Magic for Analog 2.13 Report Magic for Analog 2.13 |