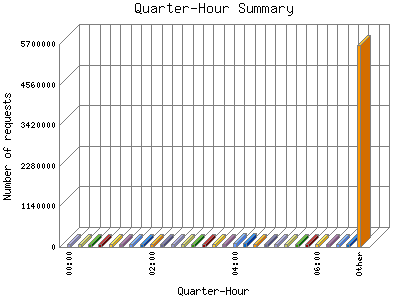
The Quarter-Hour Summary shows an overview of site activity over the course of a day, broken down into fifteen-minute intervals. If your report has enough traffic this will give you a detailed graph of your site's load throughout the day.
| Quarter-Hour | Number of requests | Percentage of the requests | |
|---|---|---|---|
| 1. | 00:00 | 136,133 | 0.93% |
| 2. | 00:15 | 135,105 | 0.93% |
| 3. | 00:30 | 143,539 | 0.99% |
| 4. | 00:45 | 137,170 | 0.94% |
| 5. | 01:00 | 138,509 | 0.96% |
| 6. | 01:15 | 133,587 | 0.92% |
| 7. | 01:30 | 177,361 | 1.22% |
| 8. | 01:45 | 130,820 | 0.90% |
| 9. | 02:00 | 138,511 | 0.96% |
| 10. | 02:15 | 142,087 | 0.98% |
| 11. | 02:30 | 175,334 | 1.20% |
| 12. | 02:45 | 141,781 | 0.98% |
| 13. | 03:00 | 149,453 | 1.3% |
| 14. | 03:15 | 181,954 | 1.26% |
| 15. | 03:30 | 144,274 | 0.100% |
| 16. | 03:45 | 197,428 | 1.37% |
| 17. | 04:00 | 201,116 | 1.39% |
| 18. | 04:15 | 249,836 | 1.72% |
| 19. | 04:30 | 169,988 | 1.18% |
| 20. | 04:45 | 183,904 | 1.27% |
| 21. | 05:00 | 139,858 | 0.97% |
| 22. | 05:15 | 139,320 | 0.97% |
| 23. | 05:30 | 140,263 | 0.97% |
| 24. | 05:45 | 217,762 | 1.50% |
| 25. | 06:00 | 144,580 | 0.100% |
| 26. | 06:15 | 154,107 | 1.7% |
| 27. | 06:30 | 175,268 | 1.20% |
| 28. | 06:45 | 193,909 | 1.33% |
| 29. | 07:00 | 147,436 | 1.1% |
| 30. | 07:15 | 149,754 | 1.3% |
| 31. | 07:30 | 147,690 | 1.1% |
| 32. | 07:45 | 222,082 | 1.53% |
| 33. | 08:00 | 140,777 | 0.98% |
| 34. | 08:15 | 141,678 | 0.98% |
| 35. | 08:30 | 142,027 | 0.98% |
| 36. | 08:45 | 134,563 | 0.92% |
| 37. | 09:00 | 145,143 | 1% |
| 38. | 09:15 | 145,973 | 1% |
| 39. | 09:30 | 145,548 | 1% |
| 40. | 09:45 | 134,405 | 0.92% |
| 41. | 10:00 | 137,087 | 0.94% |
| 42. | 10:15 | 153,744 | 1.7% |
| 43. | 10:30 | 144,746 | 0.100% |
| 44. | 10:45 | 173,712 | 1.20% |
| 45. | 11:00 | 151,008 | 1.4% |
| 46. | 11:15 | 145,002 | 0.100% |
| 47. | 11:30 | 148,159 | 1.2% |
| 48. | 11:45 | 140,479 | 0.97% |
| 49. | 12:00 | 149,112 | 1.2% |
| 50. | 12:15 | 141,915 | 0.98% |
| 51. | 12:30 | 135,883 | 0.93% |
| 52. | 12:45 | 169,959 | 1.18% |
| 53. | 13:00 | 130,377 | 0.90% |
| 54. | 13:15 | 135,491 | 0.93% |
| 55. | 13:30 | 131,775 | 0.90% |
| 56. | 13:45 | 134,347 | 0.92% |
| 57. | 14:00 | 139,933 | 0.97% |
| 58. | 14:15 | 143,479 | 0.99% |
| 59. | 14:30 | 138,267 | 0.96% |
| 60. | 14:45 | 196,071 | 1.36% |
| 61. | 15:00 | 139,867 | 0.97% |
| 62. | 15:15 | 141,822 | 0.98% |
| 63. | 15:30 | 138,826 | 0.96% |
| 64. | 15:45 | 177,877 | 1.22% |
| 65. | 16:00 | 140,024 | 0.97% |
| 66. | 16:15 | 157,159 | 1.9% |
| 67. | 16:30 | 133,517 | 0.92% |
| 68. | 16:45 | 133,845 | 0.92% |
| 69. | 17:00 | 179,460 | 1.23% |
| 70. | 17:15 | 179,182 | 1.23% |
| 71. | 17:30 | 140,890 | 0.98% |
| 72. | 17:45 | 137,525 | 0.94% |
| 73. | 18:00 | 138,544 | 0.96% |
| 74. | 18:15 | 194,819 | 1.34% |
| 75. | 18:30 | 144,109 | 0.100% |
| 76. | 18:45 | 140,151 | 0.97% |
| 77. | 19:00 | 143,439 | 0.99% |
| 78. | 19:15 | 139,384 | 0.97% |
| 79. | 19:30 | 143,476 | 0.99% |
| 80. | 19:45 | 144,628 | 0.100% |
| 81. | 20:00 | 136,452 | 0.94% |
| 82. | 20:15 | 132,159 | 0.91% |
| 83. | 20:30 | 137,172 | 0.94% |
| 84. | 20:45 | 176,297 | 1.21% |
| 85. | 21:00 | 133,784 | 0.92% |
| 86. | 21:15 | 140,297 | 0.97% |
| 87. | 21:30 | 138,080 | 0.96% |
| 88. | 21:45 | 173,602 | 1.20% |
| 89. | 22:00 | 142,678 | 0.99% |
| 90. | 22:15 | 144,723 | 0.100% |
| 91. | 22:30 | 137,074 | 0.94% |
| 92. | 22:45 | 128,454 | 0.89% |
| 93. | 23:00 | 137,111 | 0.94% |
| 94. | 23:15 | 138,503 | 0.96% |
| 95. | 23:30 | 137,324 | 0.94% |
| 96. | 23:45 | 136,961 | 0.94% |
This report was generated on August 3, 2026 01:33.
Report time frame August 28, 2016 04:27 to August 2, 2026 04:59.
| Web statistics report produced by: | |
 Analog 5.24 Analog 5.24 |  Report Magic for Analog 2.13 Report Magic for Analog 2.13 |