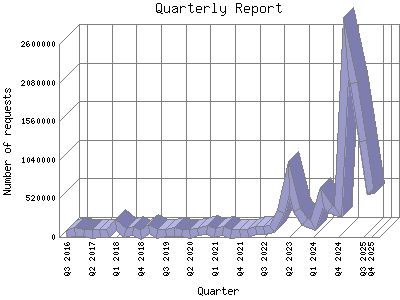
The Quarterly Report shows total activity on your site for each quarter of a
year. Remember that each page hit can result in several server requests as the
images for each page are loaded.
Note: Most likely, the first and
last quarters will not represent a complete quarter's worth of data, resulting
in lower hits.
| Quarter | Number of requests | Percentage of the requests | |
|---|---|---|---|
| 1. | Q3 2026 | 33,326 | 0.23% |
| 2. | Q2 2026 | 932,478 | 6.54% |
| 3. | Q1 2026 | 1,602,208 | 11.26% |
| 4. | Q4 2025 | 928,564 | 6.52% |
| 5. | Q3 2025 | 1,290,808 | 9.7% |
| 6. | Q2 2025 | 2,071,856 | 14.54% |
| 7. | Q1 2025 | 2,561,202 | 17.99% |
| 8. | Q4 2024 | 330,105 | 2.31% |
| 9. | Q3 2024 | 372,054 | 2.61% |
| 10. | Q2 2024 | 538,076 | 3.78% |
| 11. | Q1 2024 | 165,933 | 1.17% |
| 12. | Q4 2023 | 203,430 | 1.42% |
| 13. | Q3 2023 | 363,274 | 2.56% |
| 14. | Q2 2023 | 801,350 | 5.62% |
| 15. | Q1 2023 | 330,834 | 2.32% |
| 16. | Q4 2022 | 102,312 | 0.71% |
| 17. | Q3 2022 | 90,007 | 0.63% |
| 18. | Q2 2022 | 93,720 | 0.66% |
| 19. | Q1 2022 | 59,066 | 0.41% |
| 20. | Q4 2021 | 55,278 | 0.39% |
| 21. | Q3 2021 | 46,307 | 0.32% |
| 22. | Q2 2021 | 74,606 | 0.52% |
| 23. | Q1 2021 | 51,127 | 0.36% |
| 24. | Q4 2020 | 90,892 | 0.63% |
| 25. | Q3 2020 | 61,368 | 0.43% |
| 26. | Q2 2020 | 34,049 | 0.23% |
| 27. | Q1 2020 | 53,670 | 0.38% |
| 28. | Q4 2019 | 65,544 | 0.47% |
| 29. | Q3 2019 | 49,992 | 0.36% |
| 30. | Q2 2019 | 34,271 | 0.24% |
| 31. | Q1 2019 | 112,422 | 0.79% |
| 32. | Q4 2018 | 32,017 | 0.22% |
| 33. | Q3 2018 | 76,038 | 0.53% |
| 34. | Q2 2018 | 49,476 | 0.34% |
| 35. | Q1 2018 | 159,673 | 1.12% |
| 36. | Q4 2017 | 56,902 | 0.40% |
| 37. | Q3 2017 | 51,637 | 0.37% |
| 38. | Q2 2017 | 45,700 | 0.32% |
| 39. | Q1 2017 | 57,805 | 0.40% |
| 40. | Q4 2016 | 72,358 | 0.50% |
| 41. | Q3 2016 | 39,602 | 0.28% |
Most active quarter Q1 2025 : 2,561,202 requests handled.
Quarterly average: 347349 requests handled.
This report was generated on July 8, 2026 01:34.
Report time frame August 28, 2016 04:27 to July 7, 2026 04:57.
| Web statistics report produced by: | |
 Analog 5.24 Analog 5.24 |  Report Magic for Analog 2.13 Report Magic for Analog 2.13 |